
“What’s happening with my child?”
One recent fall, after sharing student standardized testing data, a parent reached out to
school administrators and teachers, exasperated:
“Why are his scores declining for the second test in a row? Shouldn’t he be growing?”
The usual answers were hollow: “It’s one standardized test, don’t worry. This kind of performance fluctuation can happen in a high-stakes environment. When anxiety increases, performance decreases. Did your child get a good night’s sleep before the test?”
Unsatisfied, we dug deeper, to see what else we could do in order to answer the parents’ questions about “Alex.”
Individualized Measurements
In 2013, a group of like-minded administrators at Scheck Hillel dreamed of creating what we brainstormed would be called an ILP. What if each child in our school could have an Individualized Learning Plan or Profile? We know their test scores. We know their classroom grades. What other data would be important to create this kind of plan? What if we knew so much about our students that we could partner with parents to maximize their achievement, supporting them as they explored their passions and fostered their identity?
The Measures of Academic Progress (MAP) by the Northwest Evaluation Association (NWEA) was a starting point. Their reports for teachers, administrators, students, and parents are detailed. Aligned to national core learning standards and grade level skills, MAP reports make grouping accessible by skill level, extending learning, and/or remediating specific skills. Further, MAP’s measurements of achievement and growth allow all stakeholders to measure progress on both individual and comparative levels. As a company, their continual improvements in reporting and data visualization have improved our approach to using data.
In recent years, adaptive learning practice platforms have evolved, and MAP scores can be linked to tools such as Dreambox Math, Khan Academy, IXL, NewsELA, and more. These are the low-hanging fruit of leveraging the data, and require fewer teacher and administrative touch points, making implementation of data-informed instruction easier.
However, creating the systems and structures to support data-informed planning and learning activities is daunting. Change management, teacher turnover and other factors slow progress in data usage. Nevertheless, the benefits are definitely worth the efforts. The long-term value lies in student goal-setting and processes that encourage regular practice, “bite-sized” goals, and reflection—of all stakeholders.
Standardized testing is a singular measure of student achievement. It is by far not the best measure of student progress, but it is an indicator. Other data sources help to measure student achievement: class grades, quizzes and tests, and project-based rubric scores. Attendance and tardy data may also indicate where and why a student may or may not be reaching their potential.
Back to our ILP: What other data sources could we use? Classroom grades are easily accessible. Attendance? Yes. Discipline? Yes. What about the so-called “soft skills” or what used to be called soft skills? Social-emotional learning skills?
Measuring SEL
In 2015, we found a new education company that was leveraging stakeholder feedback to improve learning. PanoramaEd uses survey tools for social-emotional learning (SEL) and school culture, among others, to support students in school systems. Our focus then was to learn more about how our students felt about their own social-emotional learning skills and competencies.
It took a few years and pilots to develop the ongoing systems and processes in order to implement these principles, and we’re still working to improve how we use them. We survey our students in Grades 3-12 annually about specific SEL skills. Beginning in Grade 3, students answer questions about growth mindset, self-management, classroom effort, and learning strategies. Students answer these same questions again in grades 5, 7, 9, and 11.
Beginning in fourth grade, students answer different questions, focusing on grit, self-efficacy, social awareness, and emotion regulation. (These same questions are asked again in grades 6, 8, 10, and 12.) The rationale behind asking questions on alternating years was to avoid survey fatigue and allow two years for growth between measurements. These surveys opened a significant window into the minds and hearts of our students.
Simultaneously, we started to ask more questions to inform that ILP idea:
- What if we were able to see all our student data in one place?
- Could be combine the standardized tests, class grades, attendance, behavior, and student self-perceptions about social-emotional learning competencies?
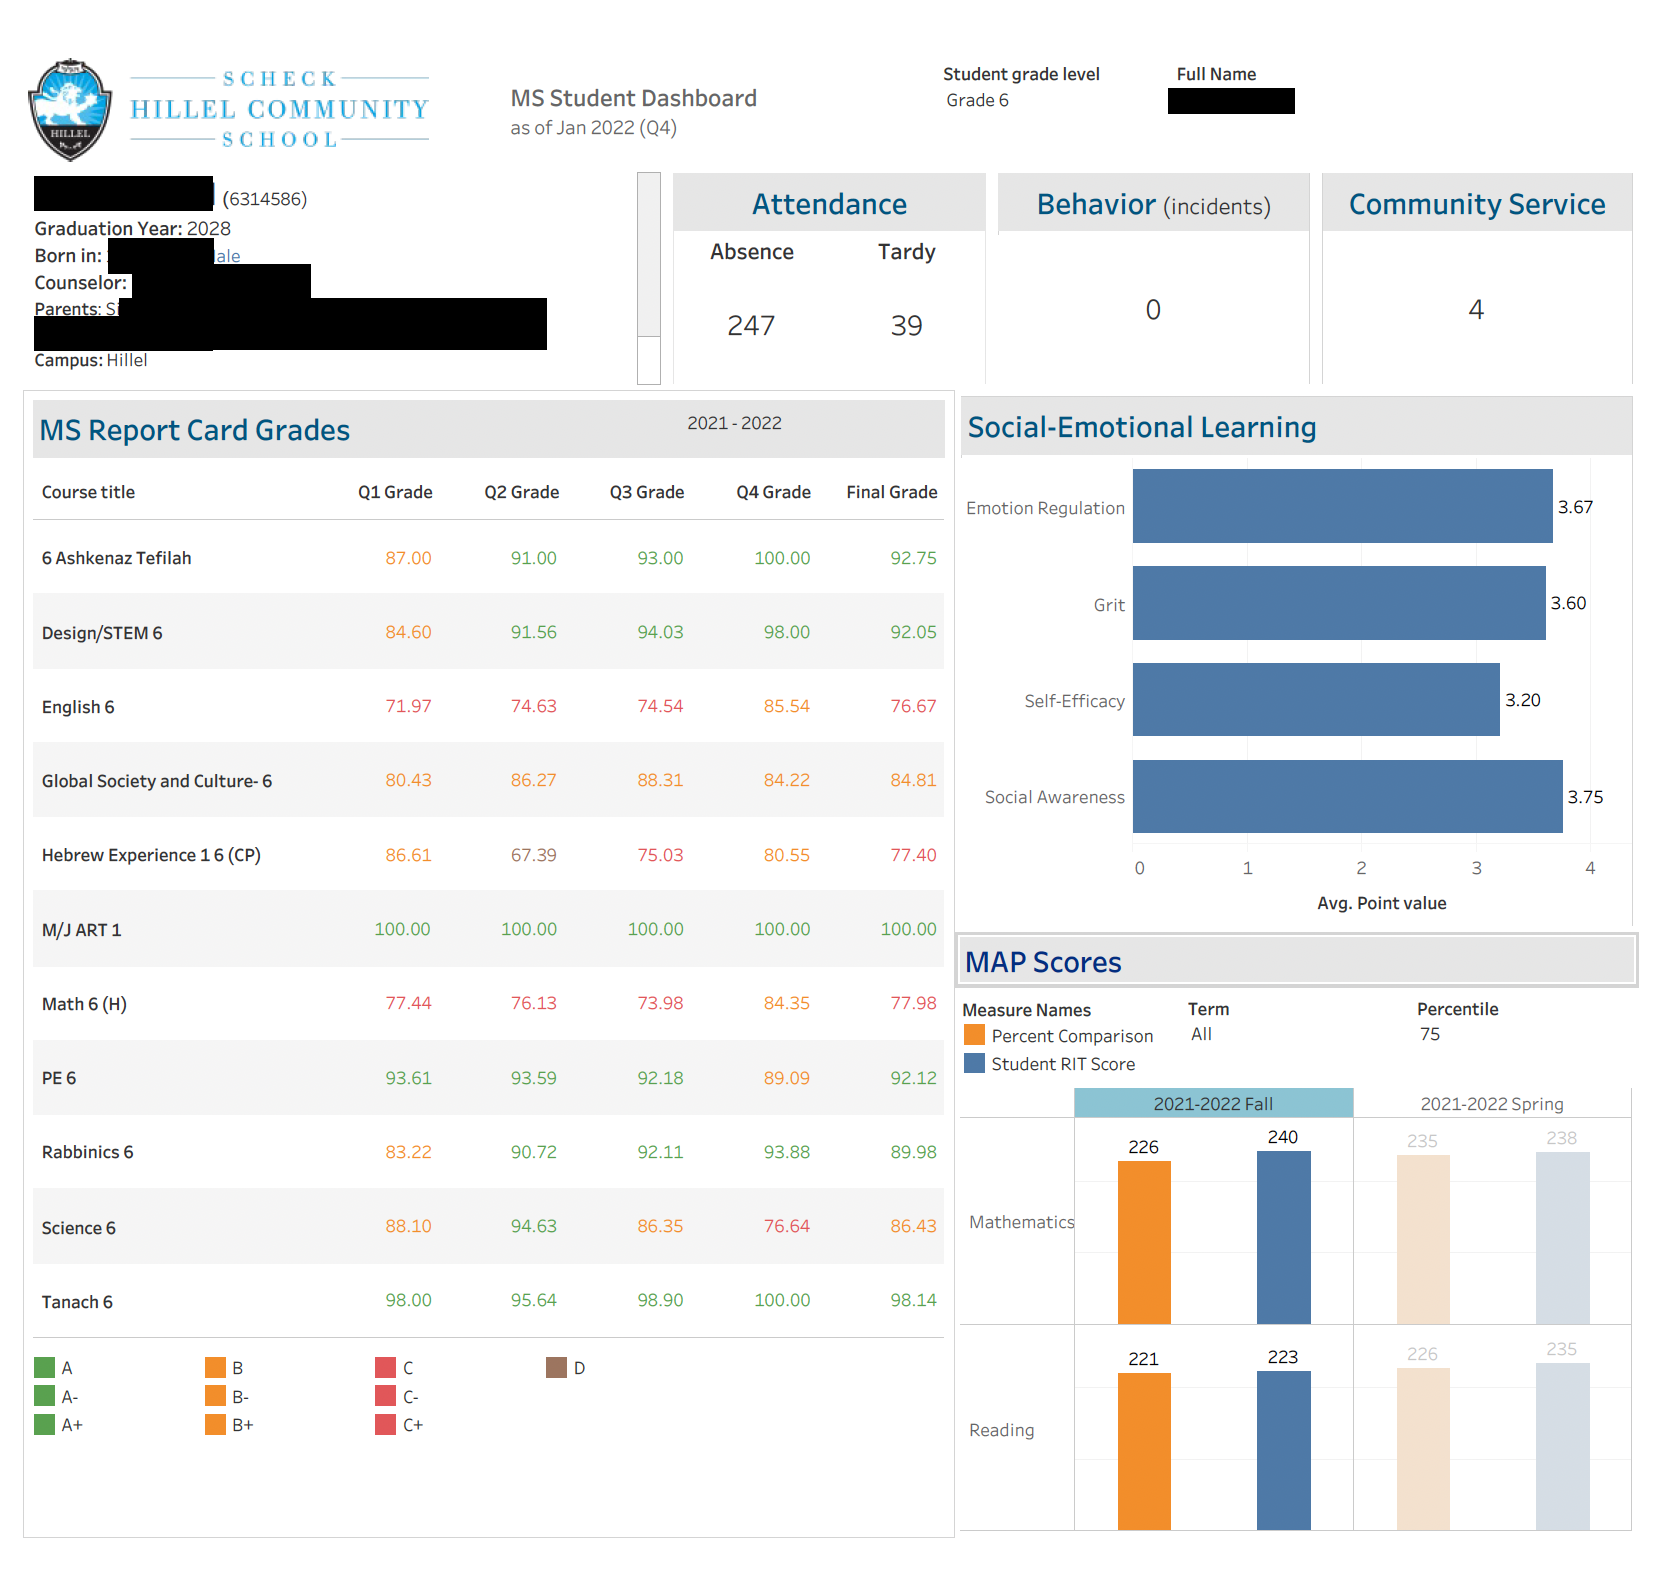
Thanks to an incredible database manager and a growth-minded team, we created a student data dashboard that is updated each term. Teachers, administrators, and counselors can access the dashboard to review student information, all in a single place. Leveraging powerful data visualization tools and techniques, we were able to create this tool for grades 2-12. Yes, the indicators are mostly lagging ones, yet combined with anecdotal teacher, counselor, administrator, student and parent input, a clearer picture and profile of the learner can be made.
Here’s a sample report of the data dashboard for our middle school division. The lower and high school divisions have different layouts that represent their respective programs.